Thesis Research

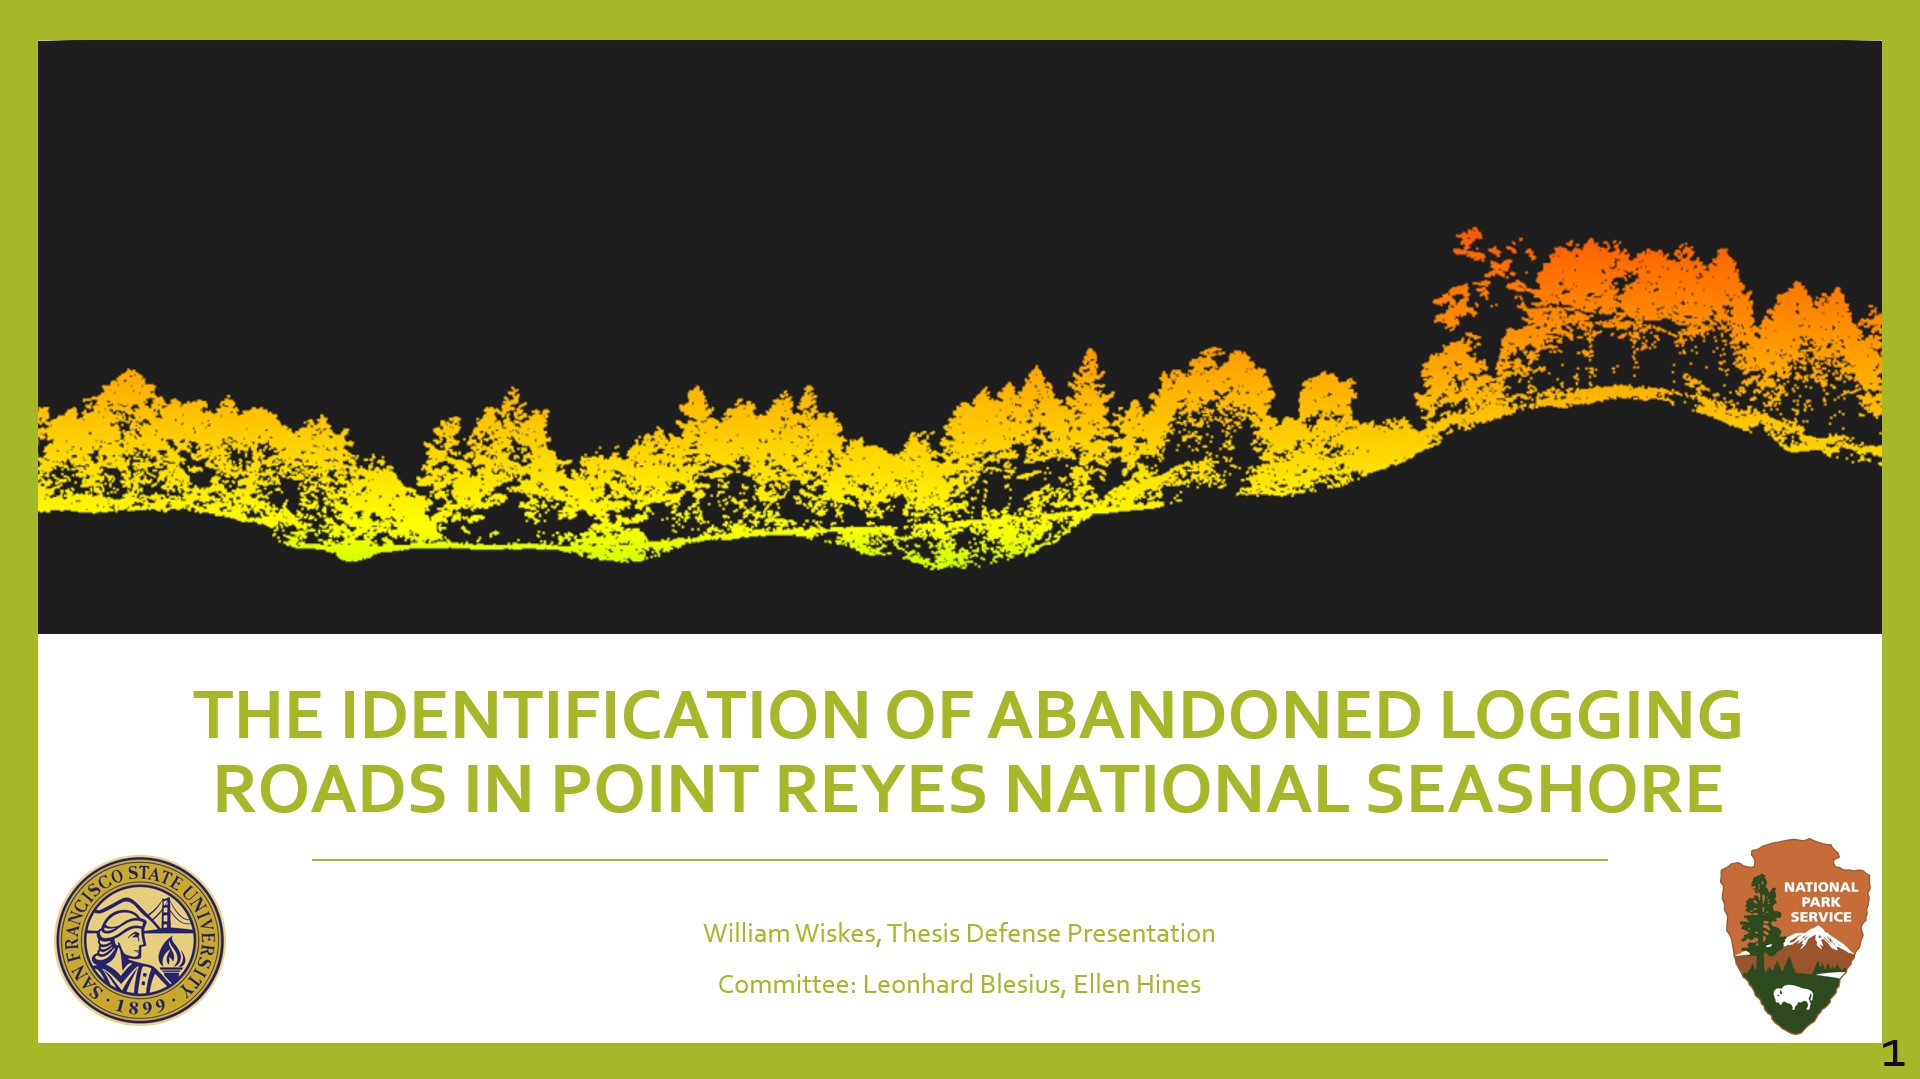
The opening slide of my Thesis Defense

The Identification of Logging Roads in Point Reyes National Seashore

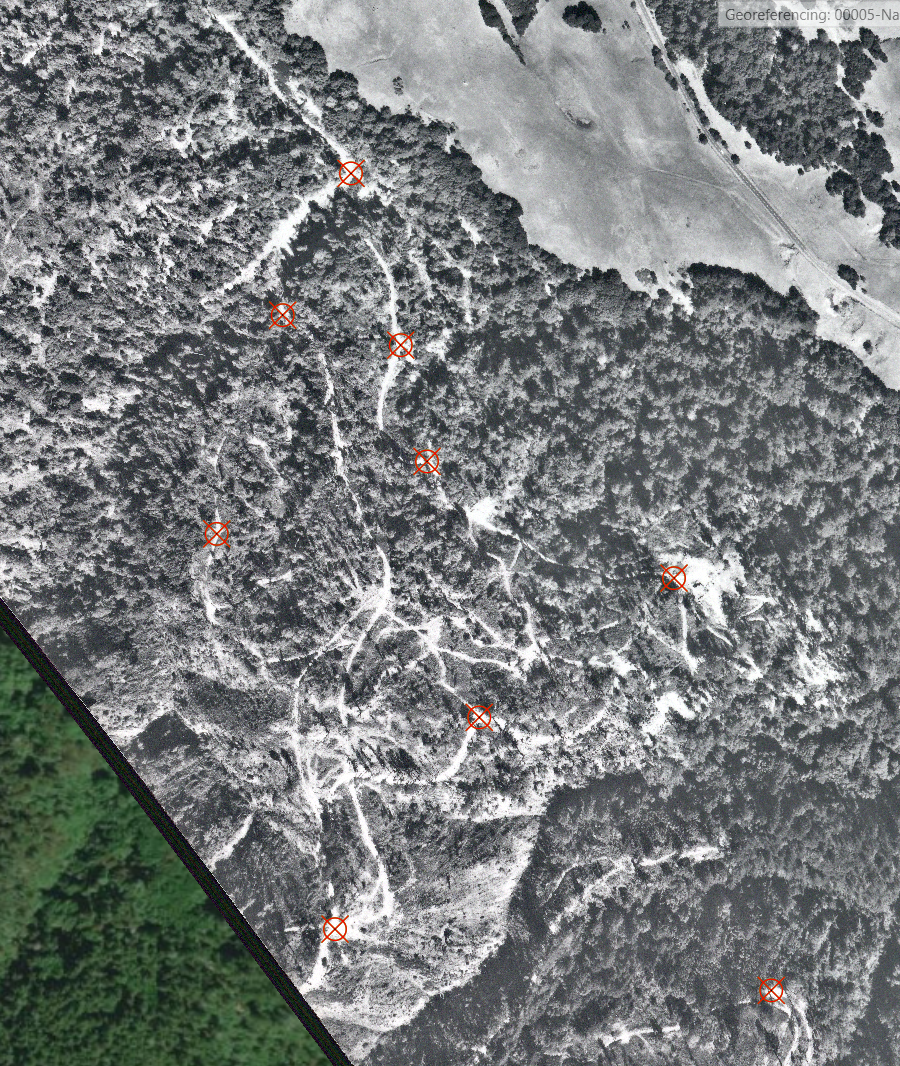
Pictured above is my opening slide of my Thesis Defense. Pictured on this slide is a slice of LiDAR I extracted in the software package ENVI, this slice is what was captured by the bounding box in the image at the top of my homepage. If you look closely in this side profile you can see a road running parallel to the slice. It was my objective in my thesis research to identify historic logging road networks in Point Reyes National Seashore underneath dense canopy. Since roads under canopy cannot be detected by aerial or satellite imagery, the only source of data I used in analysis was LiDAR. The webmap inserted here shows the LiDAR file I am working with, in the upper left you will see a pulldown to change the visible LiDAR points. With all of the LiDAR points turned on the logging roads are invisible - just like in satellite imagery. If you select just the ground points you can see what has penetrated the canopy and captured the topography of the region. These points were what was used to generate the slope model which is displayed under the points.

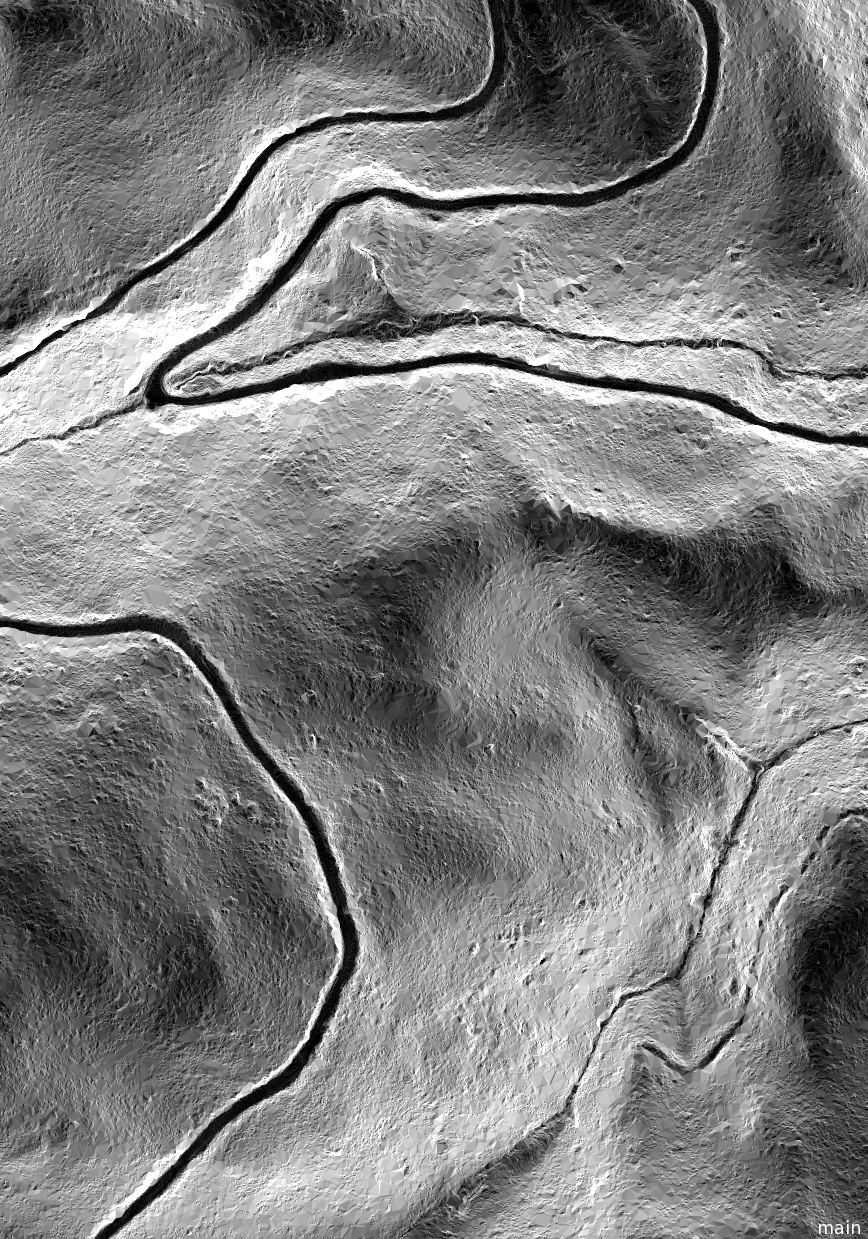
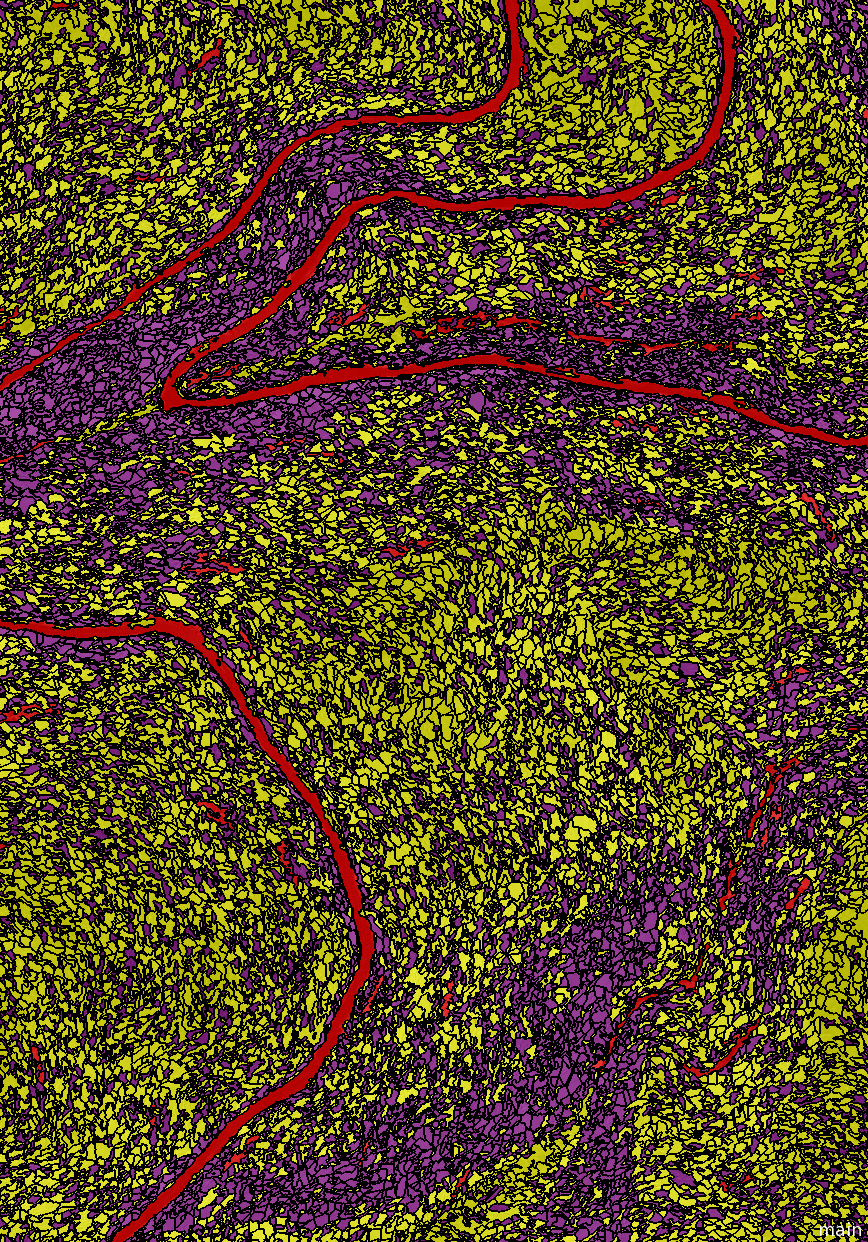
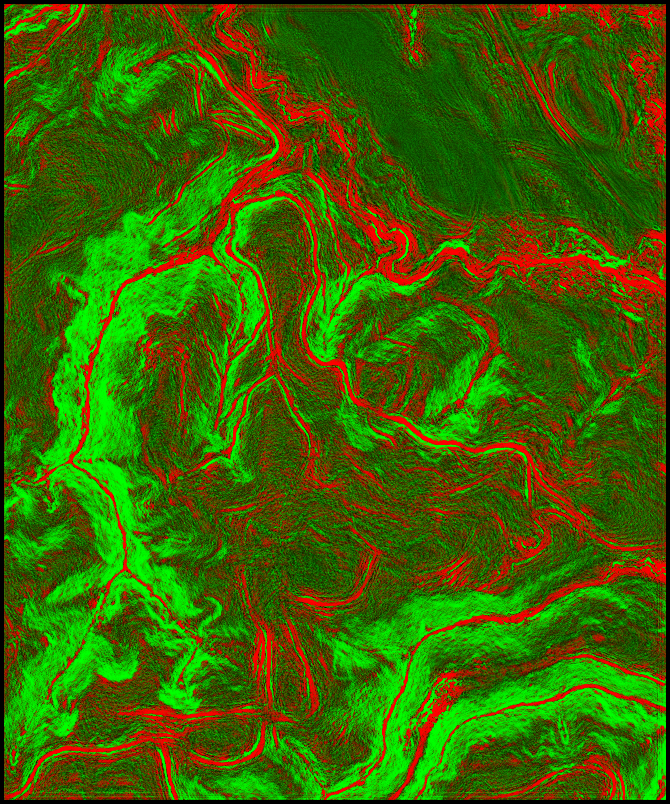
Detecting roads in LiDAR is difficult under any conditions, but degraded, eroded roads under canopy is especially difficult. The workflow is first to generate a slope raster of the ground points in the LiDAR point cloud. Next segment and classify this image in eCognition. These image objects were then used to train a convolutional neural network (CNN), which is a specific type of machine learning method. Then the resulting heatmaps were resegmented, smoothed, and converted into road network shapefiles. Historic aerial photography from before re-vegetation were used for an accuracy assessment.

Check out the JavaScript running this webmap at the bottom of the page.


Road Detection Workflow


My thesis was accepted in May of 2022 and published in August of 2022. Check out the publication on Scholar Works.


JavaScript

The 3d webmap above was created in CesiumJS. CesiumJS is an opensource library for tiling, visualizing, sharing, and analyzing 3d geospatial data. Unlike other libraries, like Leaflet or Mapbox, Cesium is out-of-the-box 3d. You can see below that in just under 100 lines of code I was able to create a custom 3d webmap with a pulldown to filter my point data.

Get in touch

Any questions at all just drop me a line, I usually respond within a couple days.